The purpose of Lab 7 was to implement a Kalman Filter to speed up our PID controller from Lab 5. The Kalman Filter
will help speed up the slow ToF values such that our cars can speed towards the wall as fast as possible, then
either stop 1ft from the wall or turn within 2ft.
Estimating Drag and Momentum
A Kalman filter is an algorithm that optimally estimates a system's state by balancing predictions with new
measurements. It works by continuously forecasting where a system should be, then adjusting this prediction when
actual measurements arrive. The filter intelligently weights each data source based on their estimated
reliability,
making it particularly effective for noisy environments.
The first step in implementing the Kalman Filter involved developing a state space model for our system, which
required estimating drag and momentum parameters. To do this, I followed the steps described in the lab
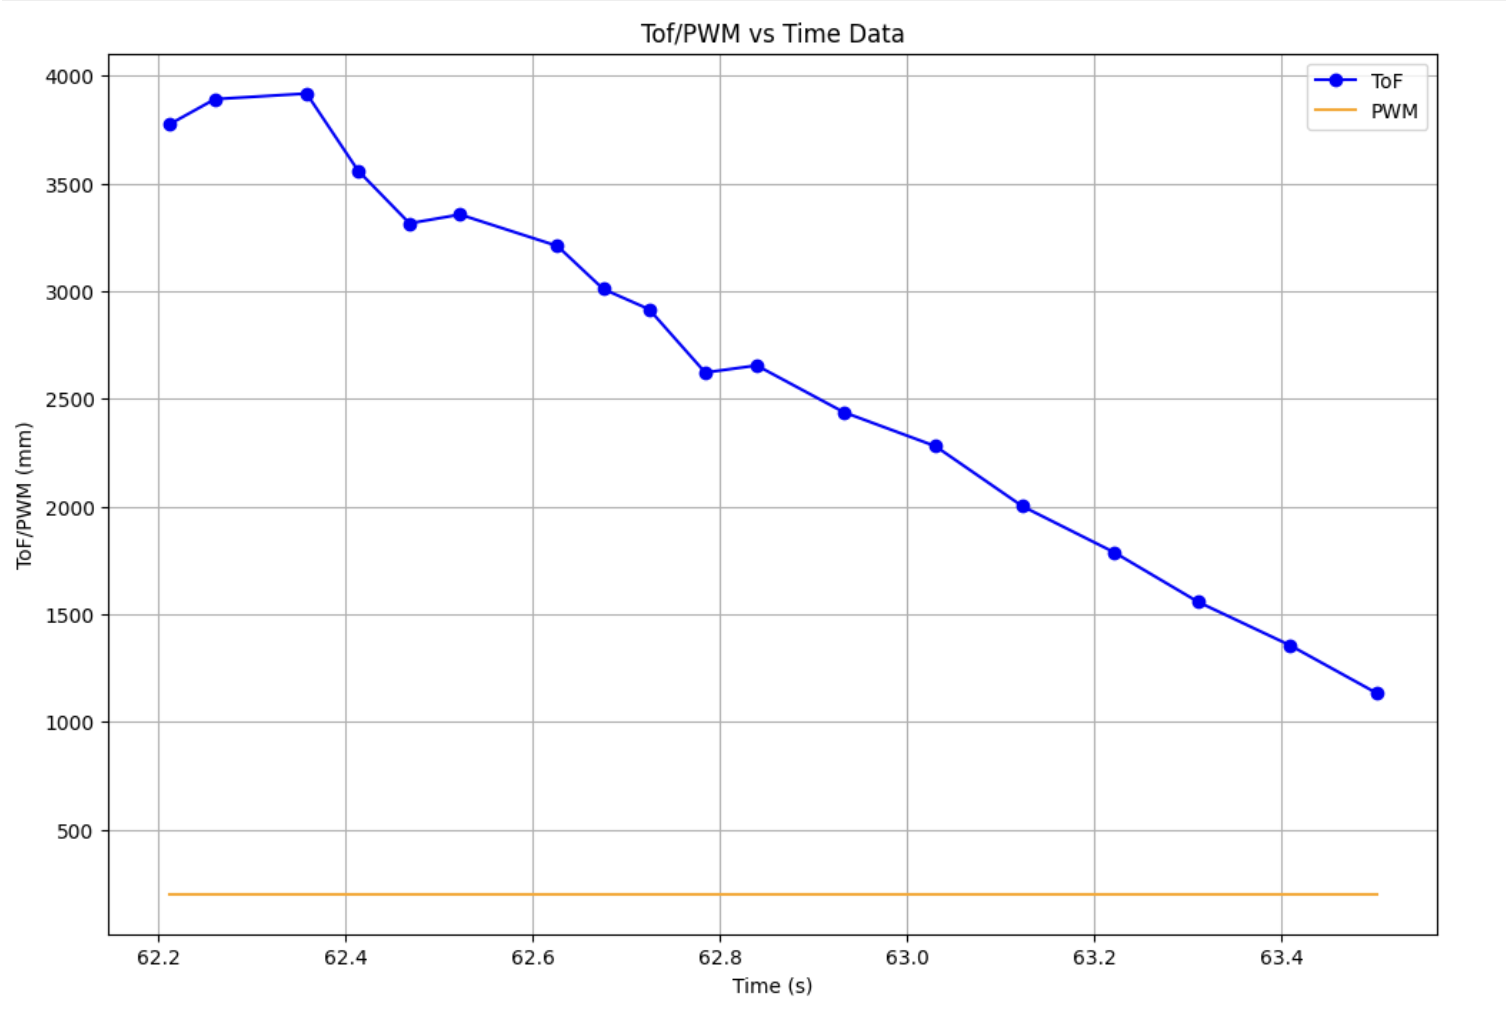
handout and drove the car toward a wall at a consistent PWM using a PID controller, while recording
Time-of-Flight (ToF) sensor measurements. I chose to use a PWM value of
180 which is 70% of the max PWM of 255. From this I got the following graphs:
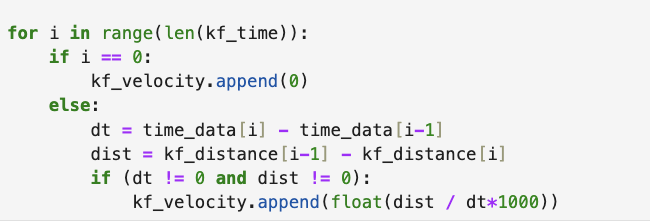
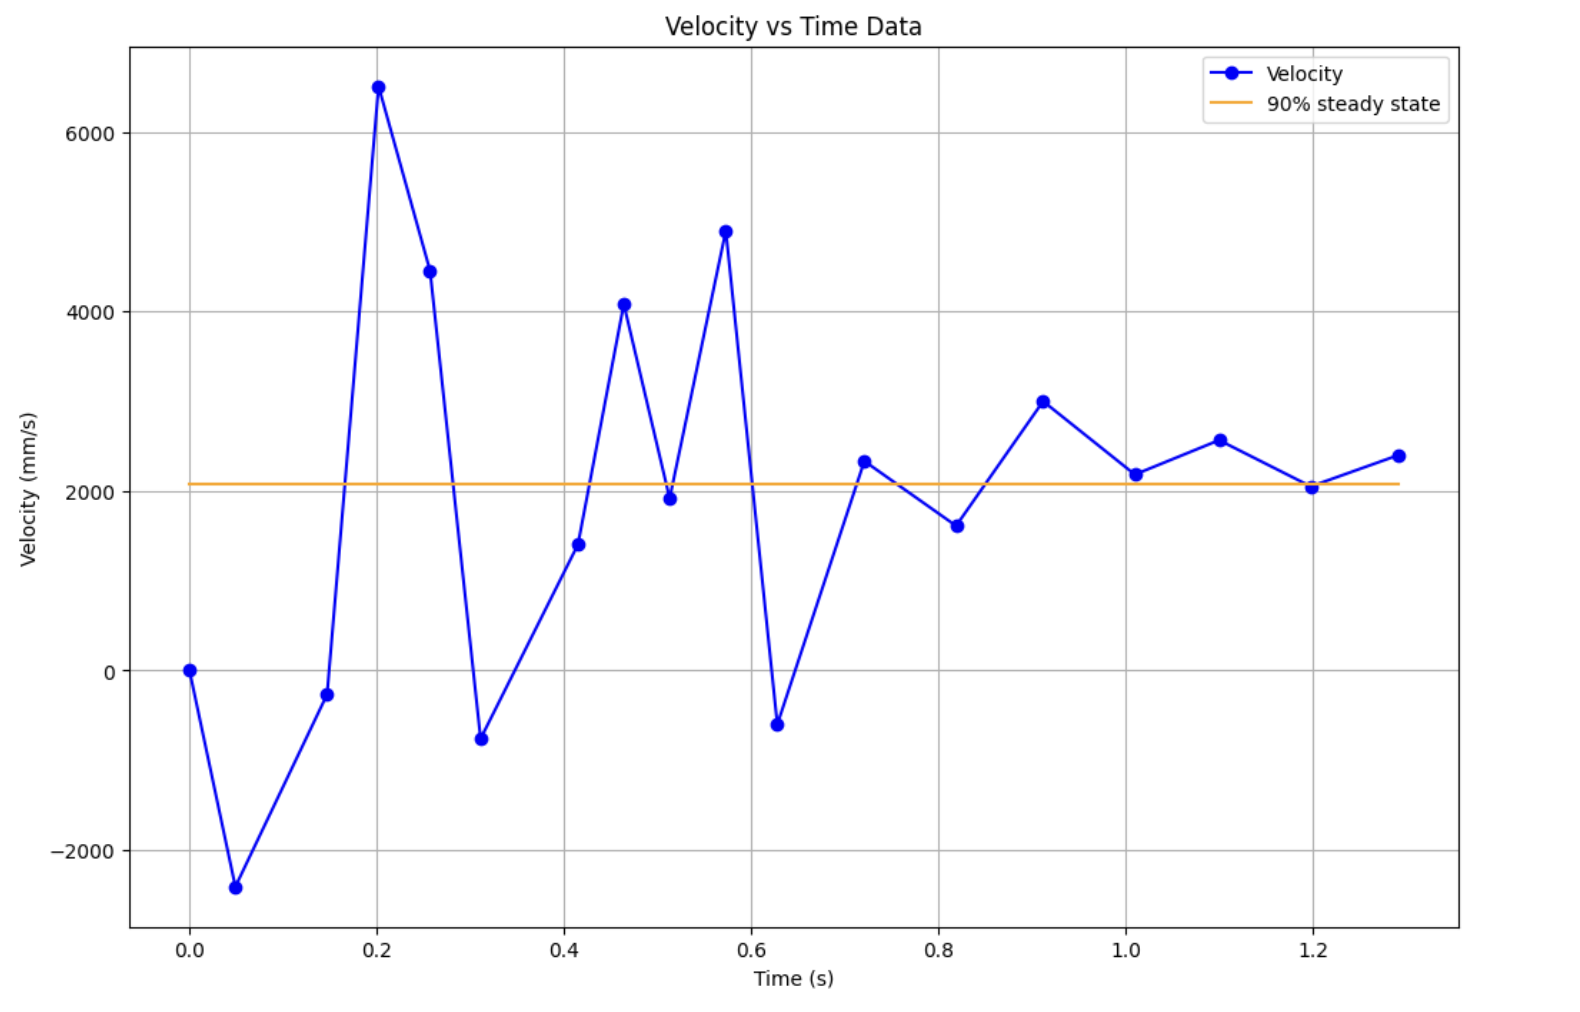
To calculate the velocity I used the following code. I just calculated distance/time at each time step except the
first one.
I then graphed the calculated velocities:
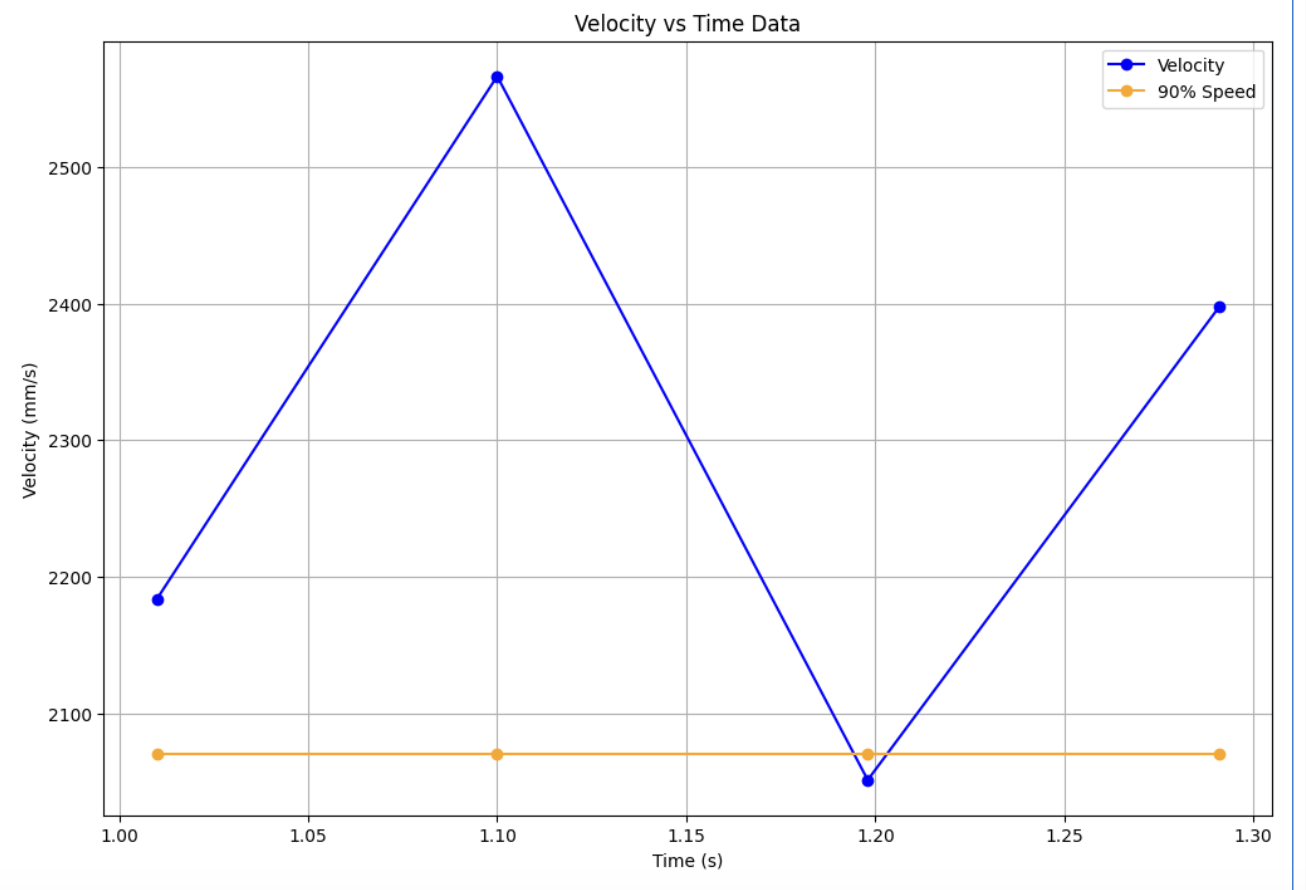
The velocity graph was quite noisy as can be seen above. However, by ignoring the beginning noisy section the last
few data points show some steady state. By zooming into that part of the graph the steady state velocity of the
system was estimated to be around ~230 mm/s. To find the 90% rise time, I plotted the 90% steady state velocity on
the graph, which was 207 mm/s, and found the intersection point on the x-axis. This was found to be ~1.2s.
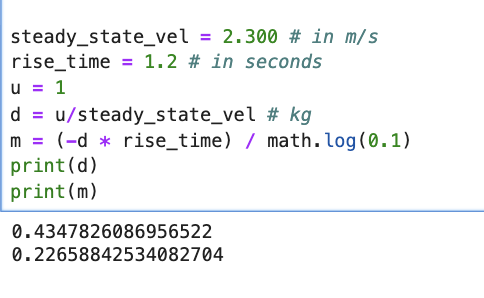
Using the following equations I found the drag and momentum using the above values.
\[ d = \frac{u_{ss}}{\dot{x}_{ss}} \]
\[ m = \frac{-d \cdot t_{0.9}}{\ln(1 - d \cdot \dot{x}_{ss})} = \frac{-d \cdot t_{0.9}}{\ln(1 - 0.9)}. \]
Initializing the Kalman Filter
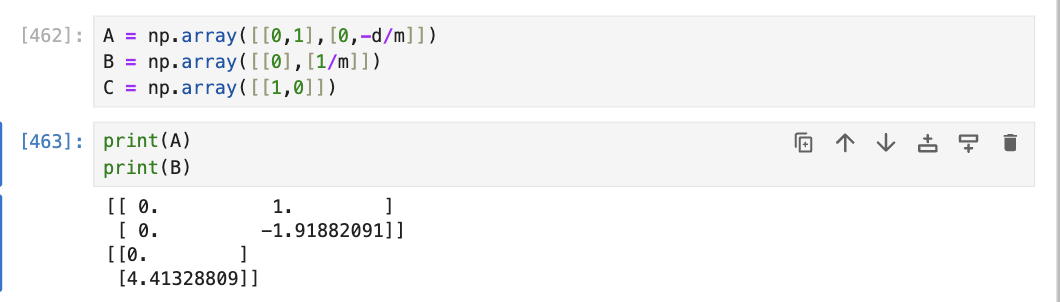
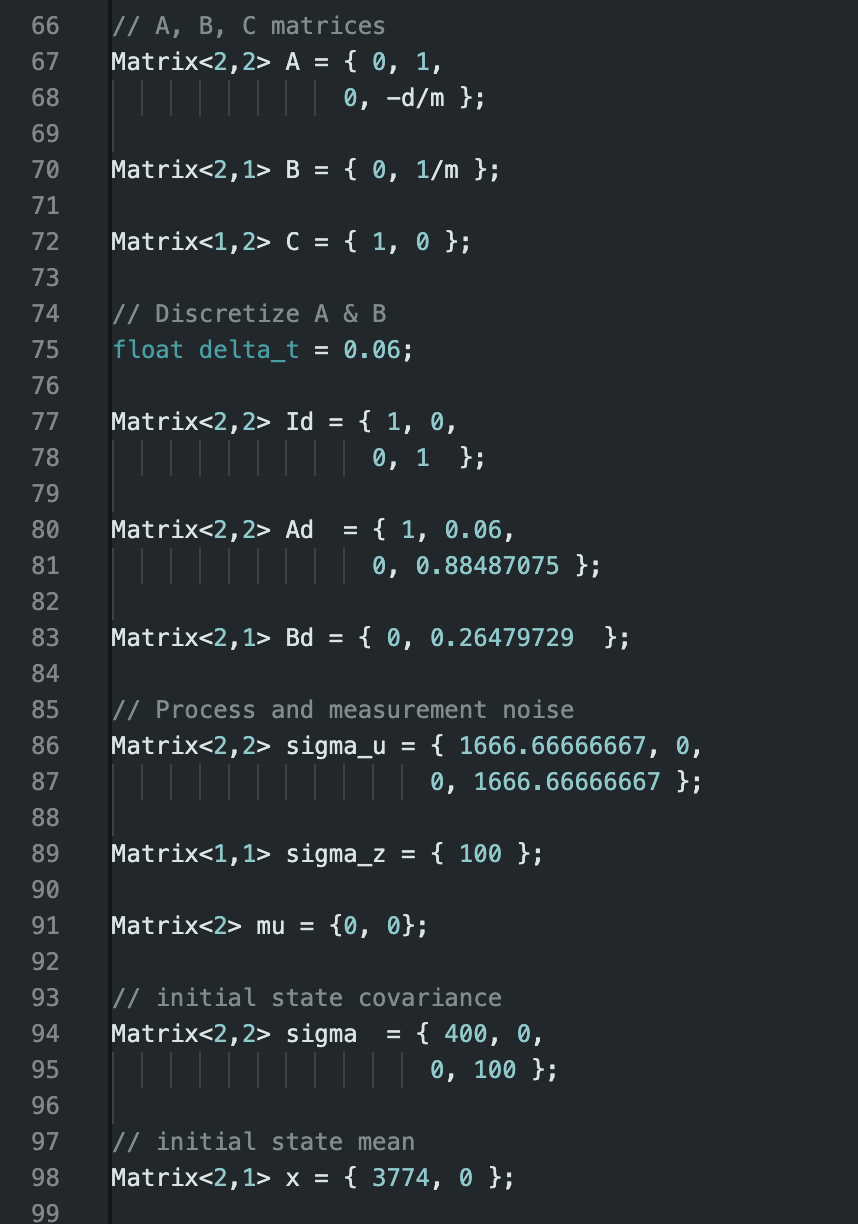
Next, using the d and m values from above I initialized the A and B matrices for the Kalman Filter.
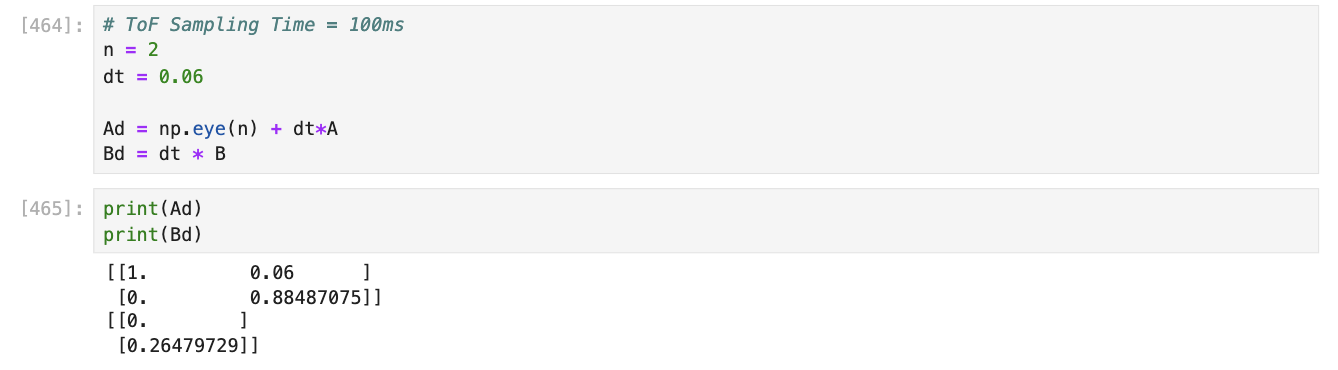
Next, I found the Ad and Bd matrices. To do this I needed the sampling time of my ToF sensor. For this I used
the array
of data points collected above that was used to find d and m. I divided the number of data points received by the
difference in the timestamps
for the first and last data points. Using this, the sampling time was found to be 19.2/28 = 0.6ms. I then just
plugged in this number to the equation for Ad and Bd.
I then initialized our C matrix which represents the states measured which is just x for this case:
\[
C = \begin{bmatrix}
1 \\
0
\end{bmatrix}
\]
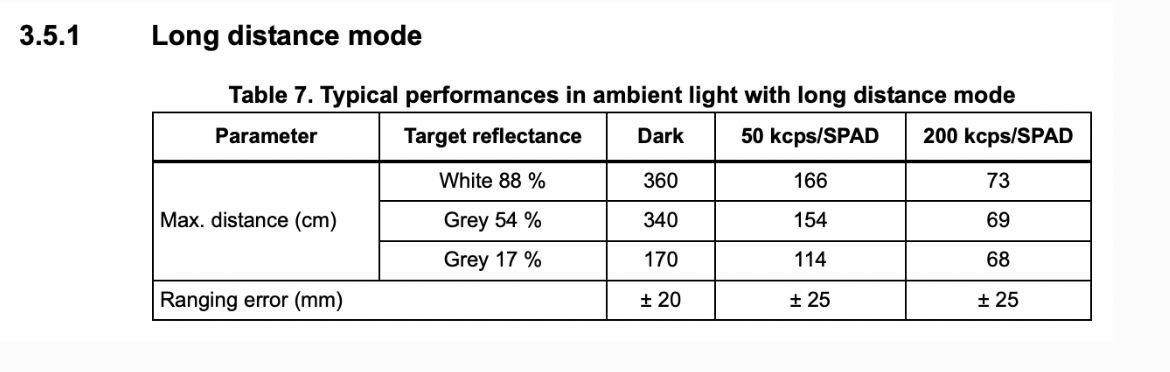
The last step was to estimate the sensor noise and process noise covariance matrices. I used the same dt value as
above. For dx I looked at the datasheet for the ToF sensor, particularly the ranging error for long distance mode
which is what I had my ToF sensor set to. From there, I found dx = 25mm. The table used is also shown below:
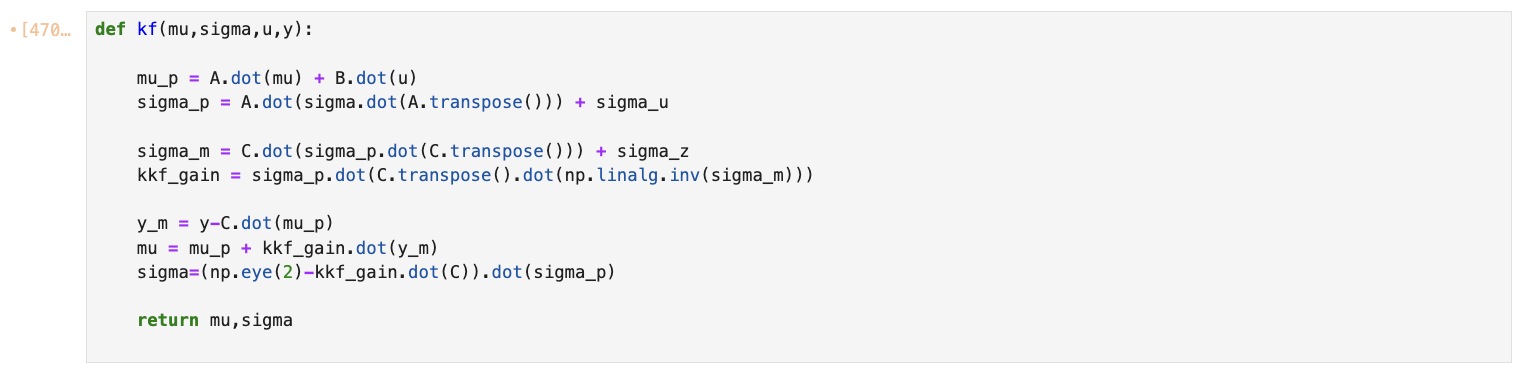
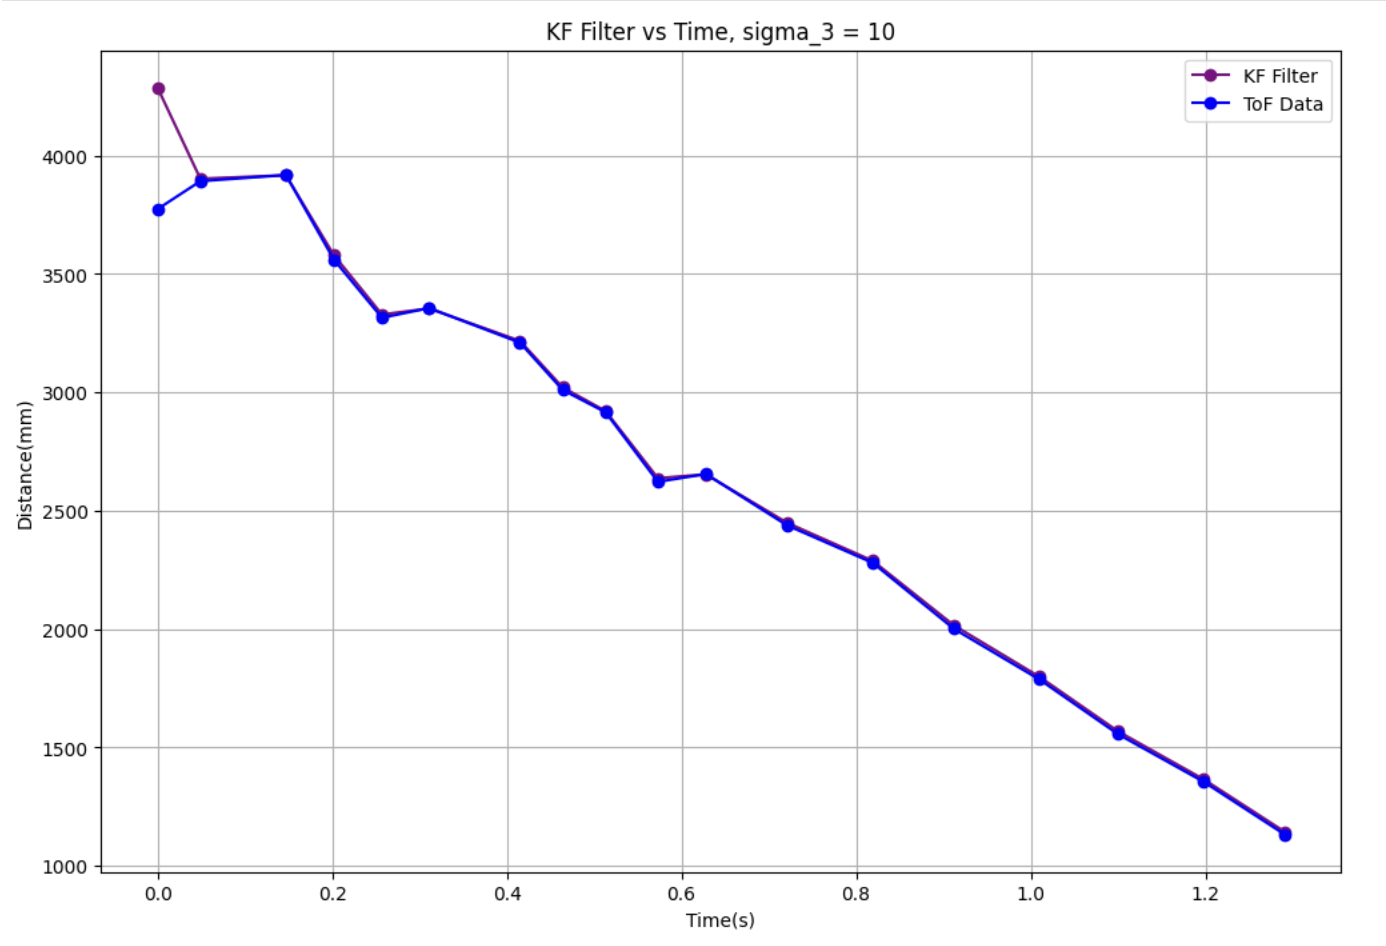
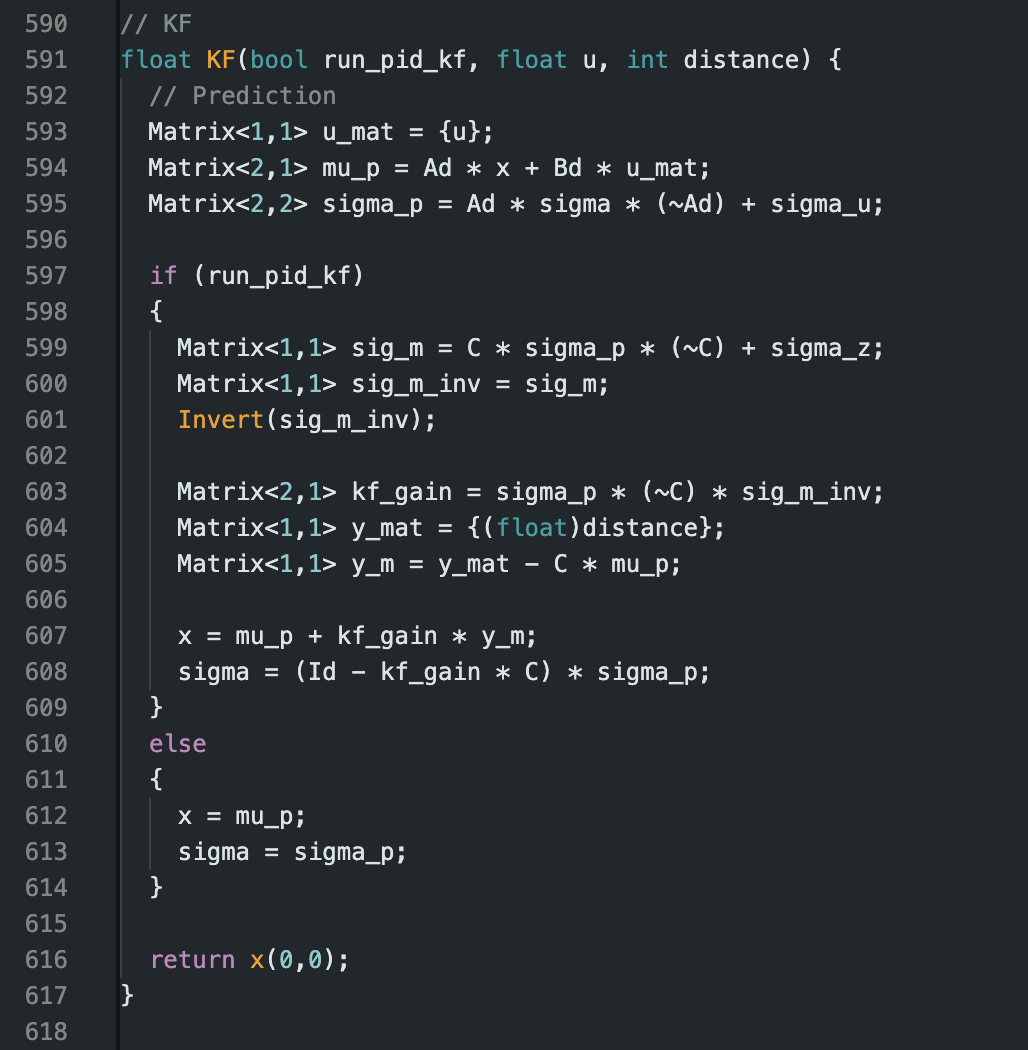
Once I had all the constants calculated, I moved on to implement the Kalman Filter in Python, using the code
provided in the lab handout:
Plotting this data shows a pretty good match between the actual ToF readings and the Kalman Filter outputs.
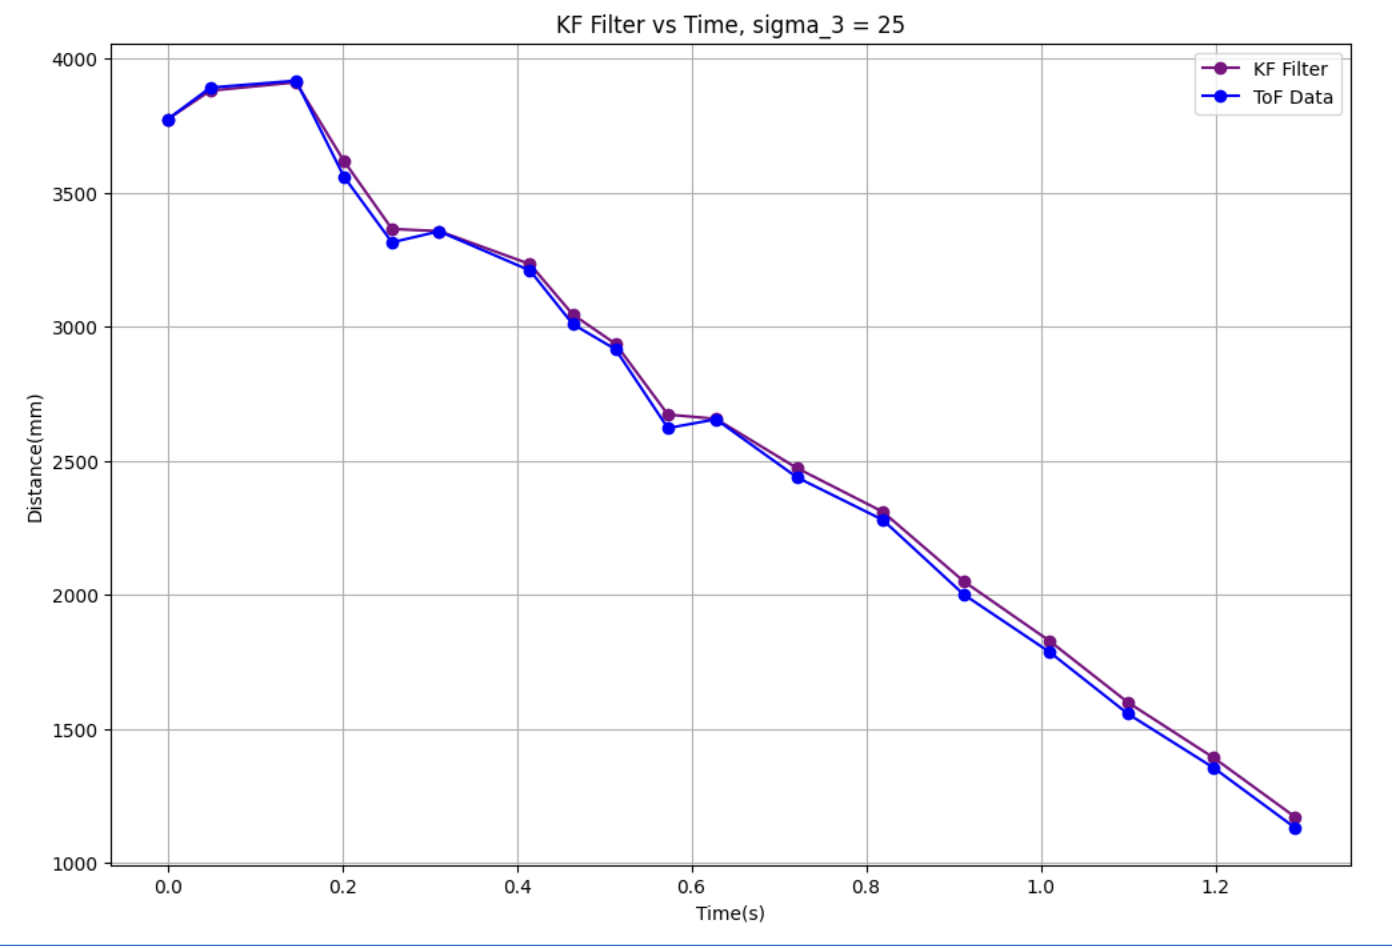
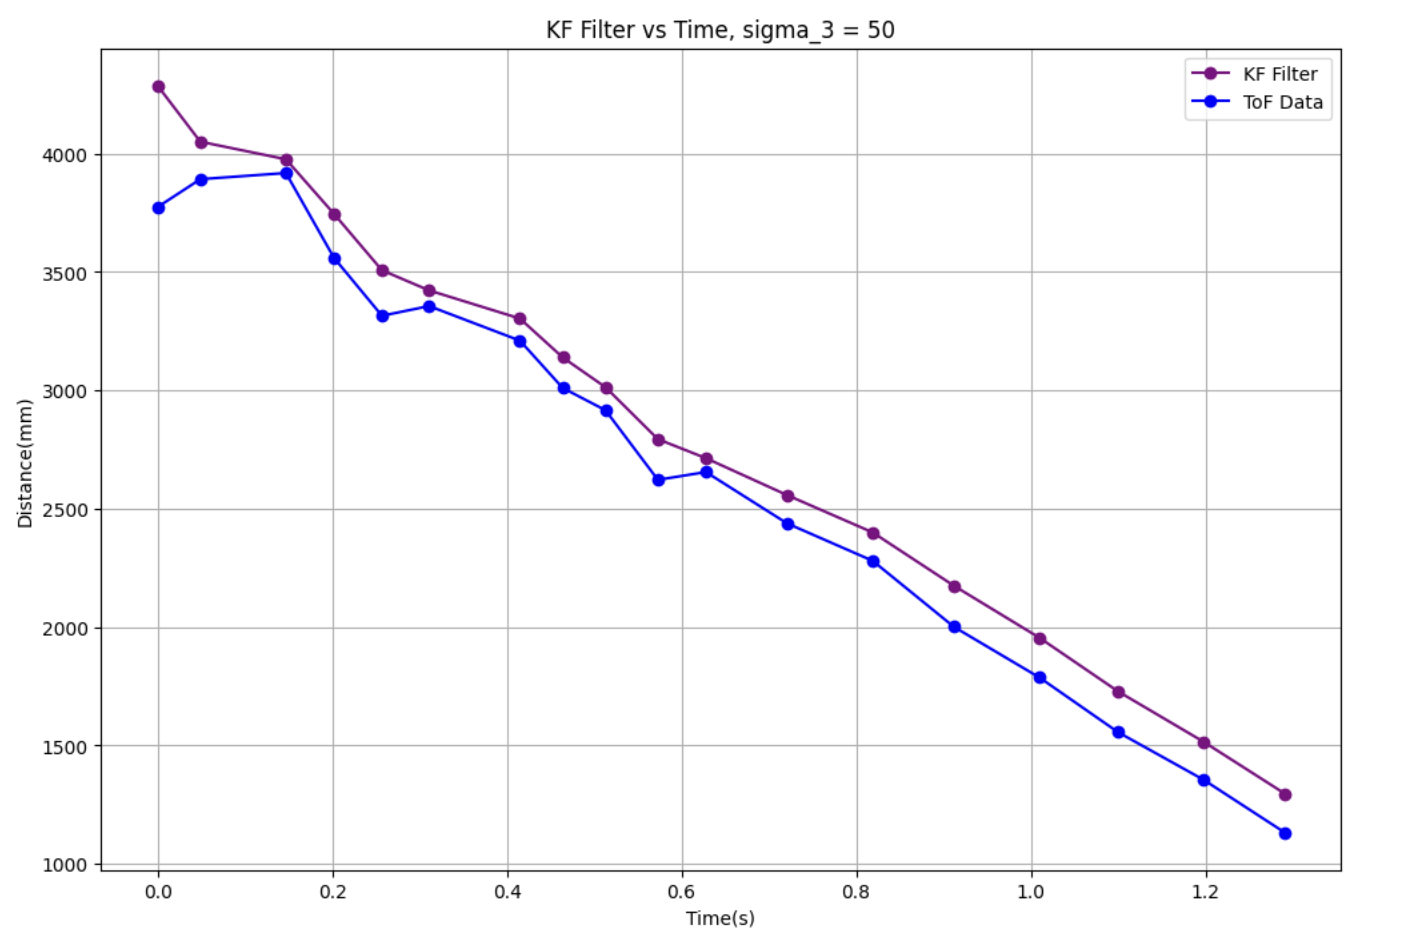
I played around a little with the covariance matrix value to see how increasing/decreasing them affects the filter
output. Increasing sensor variance tends to make the filter rely more on our model. For a sigma value of 50, I got
the following graph which shows increased reliability on the sensor data.
Kalman Filter on the Robot
Next, I implemented the KF Filter on the robot. Since I had only done PI control in lab 5 I first added in D
control to my system. I found Kd = 90.0 to be a good value for this. A video of the tuned PID controller is shown
below:
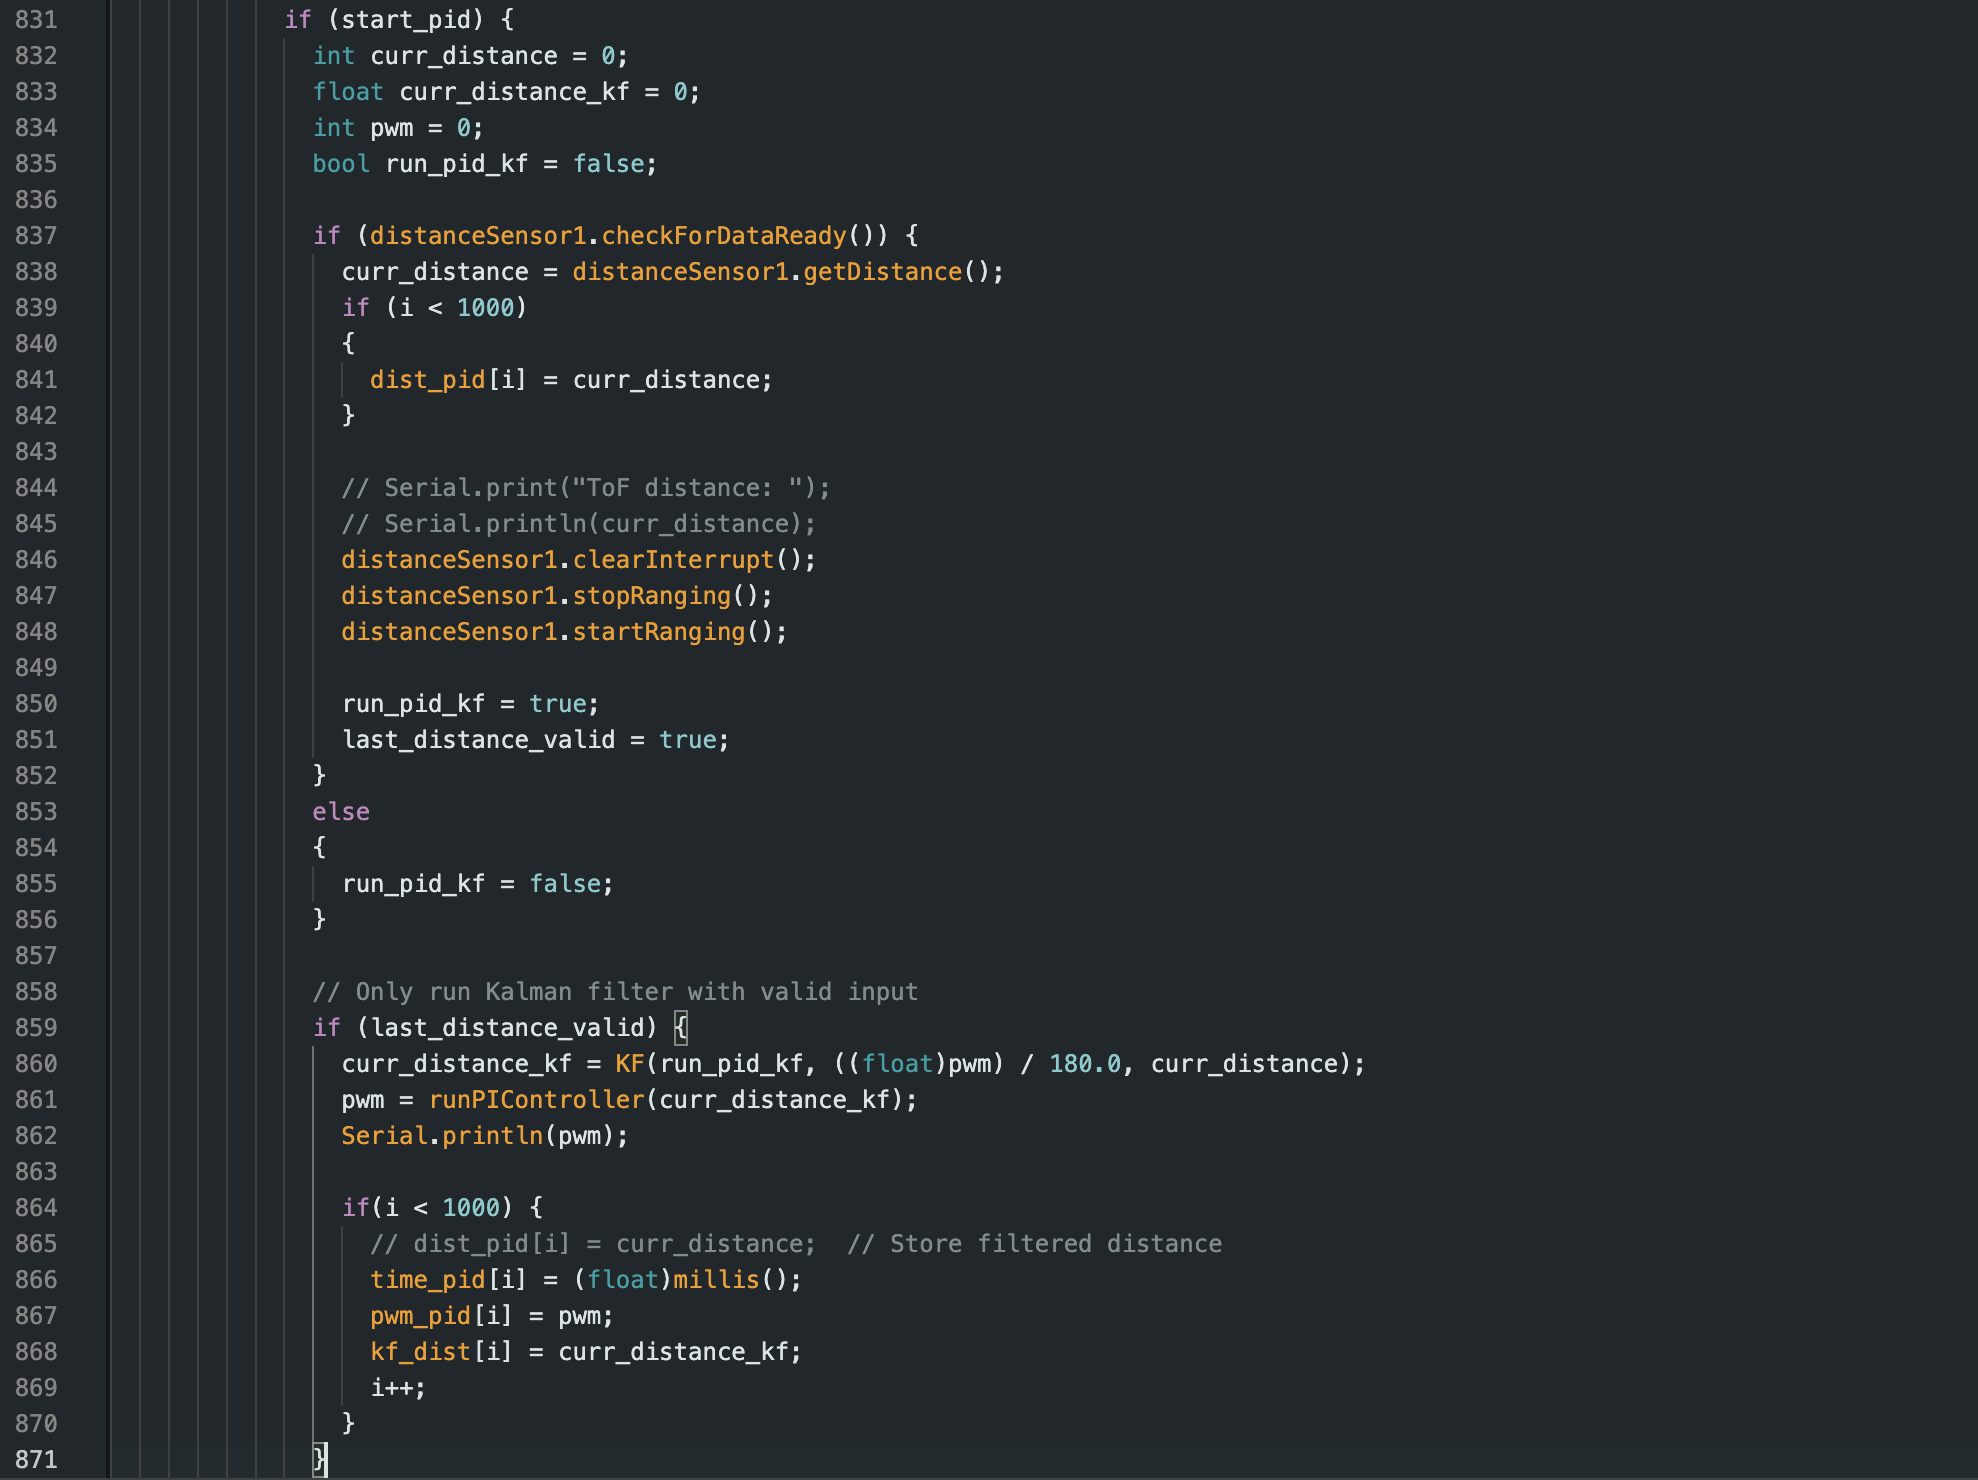
Next, I integrated my KF code into the PID
loop I had
used for Lab 5.
For the KF update function I converted the function given in the handout in Python to C. If there is no new sensor
measurement
from the ToF
sensor, I use the KF to provide a distance value to my PID controller loop. All this code is put in void loop().
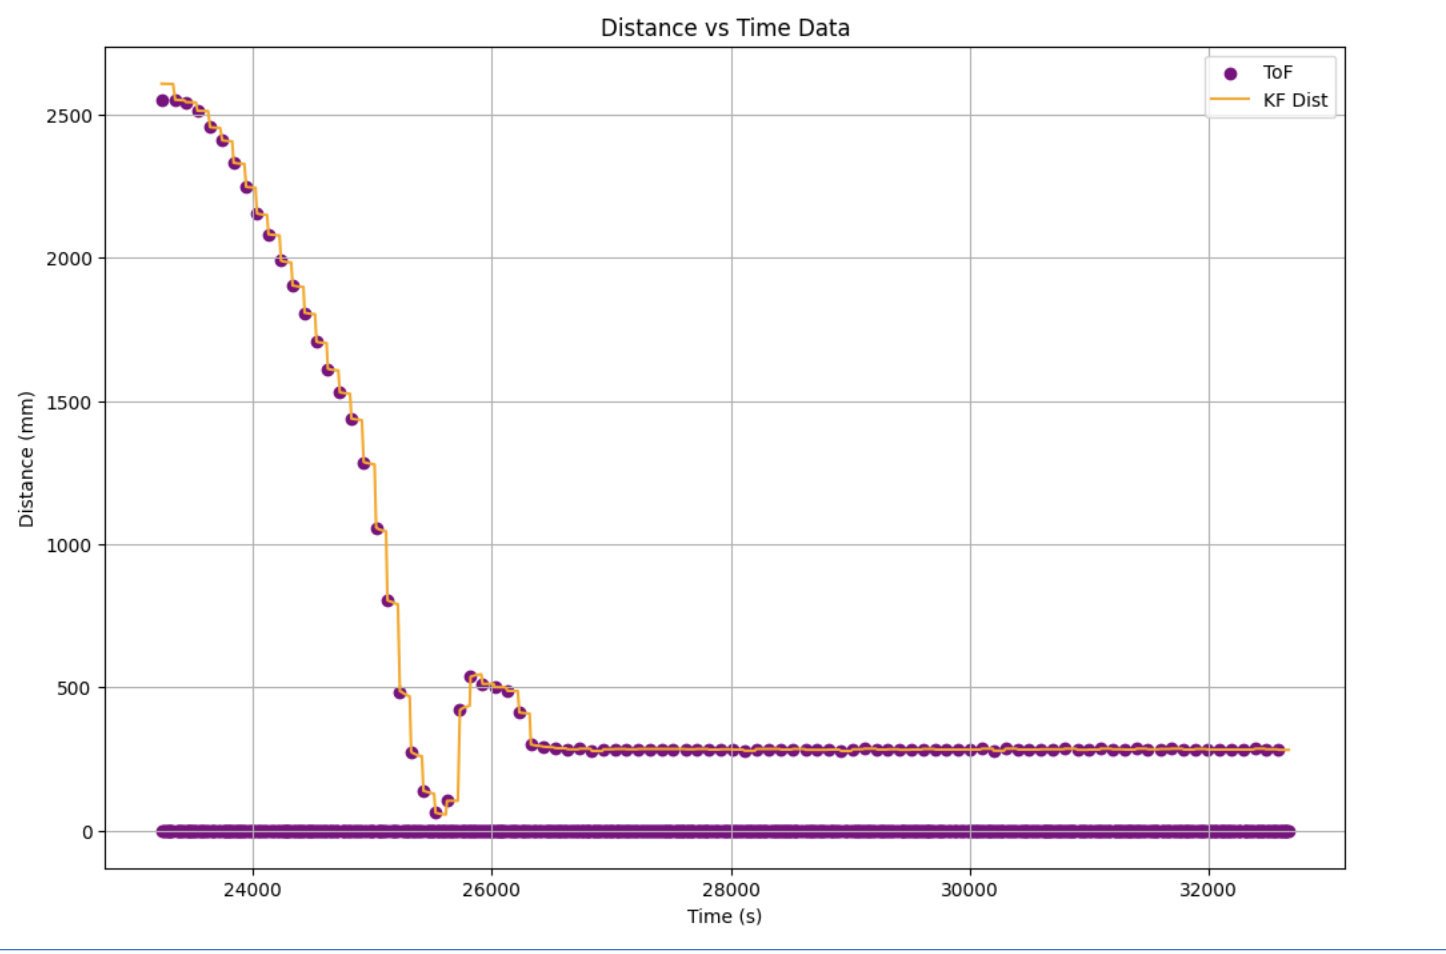
Unfortunately, for some reason I was unable to get the KF code working correctly on my robot. I also initially
thought this part of the lab was optional so I did not have enough time to thoroughly test it out :(. I was
struggling to get the PID
controller correctly tuned. Howeverm, the KF outputs were
accurately depicting the behaviour my robot was showing and the predictions were consistent with the robot
movements. I was also getting
some weird
readings from my ToF sensors and had a lot of 0 values. The graph below shows my KF readings and ToF
readings vs time for a run of my controller.
Conclusion
This lab was very useful in understanding how I can use the Kalman filtering to help improve my PID controller.
Implementing the filter in Python first was super helpful in understanding how different parameters of the filter
affect the output. It was super cool to see the KF outputs matching up with the actual sensor outputs as well ! I
hope I can improve on the tuning and get the controller to work better.
References
I referenced Stephan Wagner and Mikayla Lahr's work for Lab 7. Further, Jennie Redrovan, Lulu Htutt and I worked
on
this lab together and collaborated while figuring out the Kalman Filter implementation.